New MCSC Geospatial Tool Supports Strategic Decision-making for Decarbonizing Trucking Fleets
March 13, 2024
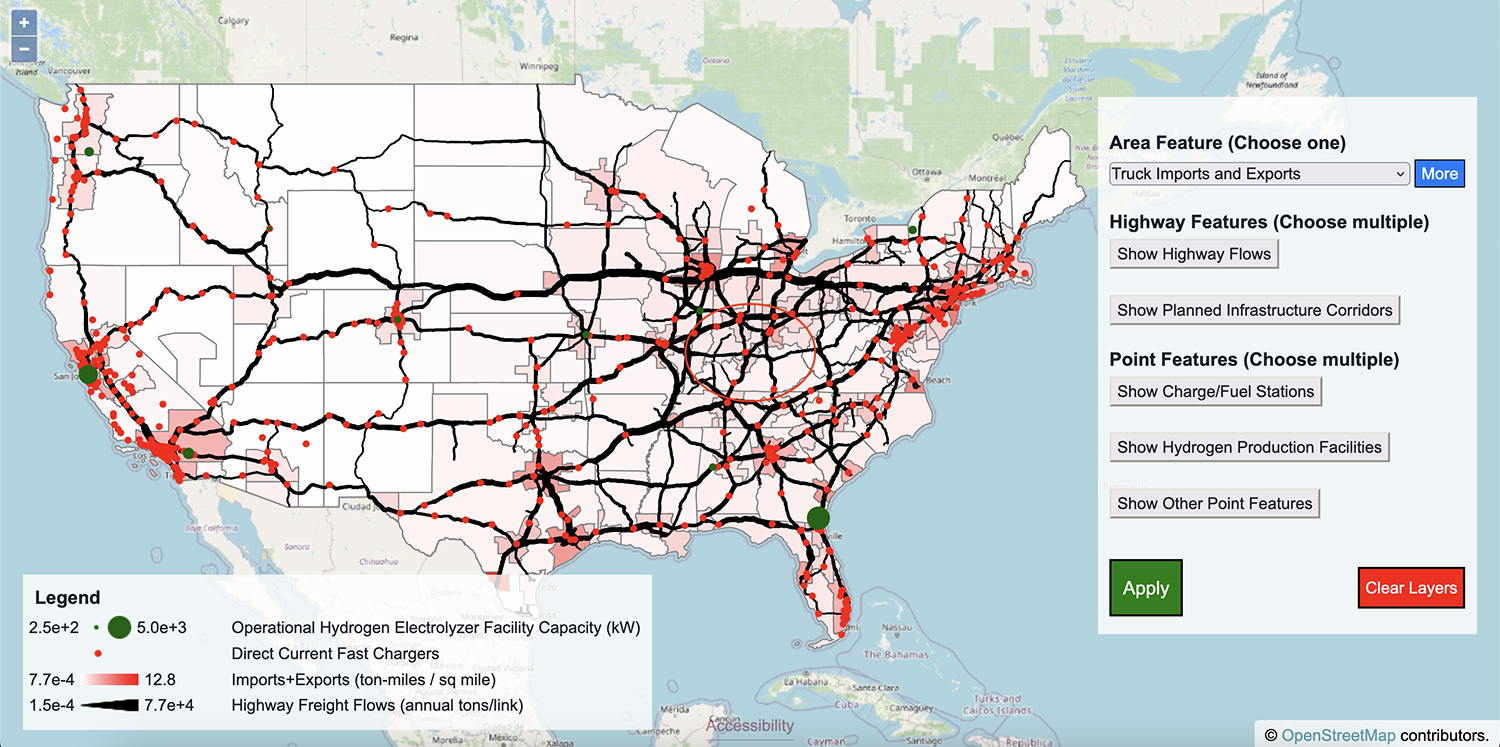
Snapshot of the interactive mapping tool.
The MCSC’s Geospatial Decision Support Tool helps trucking industry stakeholders and fleet owners assess where and how best to decarbonize their fleets by transitioning to low-carbon energy carriers. Developed by Danika MacDonell, MCSC Impact Fellow, alongside Florian Allroggen, Research Scientist, and Micah Borrero, undergraduate researcher, the tool hosts public freight-flow and emissions-related data for trucking, focusing on in-depth analysis and visualization of freight analysis framework (FAF5) data, complemented by supporting information from many other sources – such as the US Department of Transportation’s Bureau of Transportation Statistics geographic datasets, the US Environmental Protection Agency’s emissions and generation resource integrated database, and the US Energy Information Administration’s electricity data. Together, the information represents a robust geospatial picture of regional freight flow densities, planned and available infrastructure, emission intensities, and relevant regulations and incentives – leading to strategic decision-making support for fleet transitions.
The tool’s capabilities: regionality and filtering
The tool started as a way to visualize freight transported along the United States highway networks using the FAF5 data, which is maintained by the U.S. Department of Transportation’s Bureau of Transportation Statistics and shows freight movement for a range of different commodity types transported by trucking, rail, and inland shipping in the U.S. This comprehensive database was the foundation for MacDonell’s analysis and added functionalities that transformed the data into an interactive decision-making support tool.
“This work originated as a broad exploration of ‘what relevant data is out there and how can we meaningfully represent it?’ When I first started thinking about decarbonizing heavy duty transportation, my first instinct as an experimental physicist was to find out what data I could leverage to approach the challenge. Since freight movement is inherently geospatial, this seemed like a natural way to represent the data sources I was finding,” said MacDonell, who leads the MCSC’s work in its Tough Transportation Modes pathway.
Users can now visualize the total freight transportation between different FAF5 regions. This regional addition to the highway network flows helps users see where the freight transported along the highway networks is coming from and going to, an important consideration. It also allows filtering of the FAF5 data on various dimensions of interest, such as by import and export, mode and commodity, and origin and destination. Another important functionality is evaluating emissions associated with today’s freight flows, achieved through an equation that includes fuel production, tailpipe emission intensities, vehicle characteristics, and operating conditions.
Through an iterative MIT researcher and MCSC member-informed process, other layers that are now available on the map include funded infrastructure projects, state-level incentives and regulations, and locations and capacities of hydrogen production facilities. MacDonell describes more about the latest functionalities in a recent blog post, where she also shares an example of how a user might use the tool to make a strategic decision. In this example, a user can leverage the truck stop location and freight flow datasets to explore potential savings associated with economies of scale when pooling truck charging infrastructure investments along the U.S. interstate network.

Refining user experience for diverse audiences
As MacDonell has gathered feedback on the tool from different stakeholders, opportunities to refine the user experience to support a range of audiences beyond fleet owners – from policymakers to infrastructure providers to shippers to original equipment manufacturers – have emerged.
“In this exploratory phase, I have stayed open-minded about how the data can best be leveraged and by whom,” explained MacDonell. “Through interviews with different trucking industry stakeholders, I have gathered a lot of insightful feedback about what the tool would need to best support their decision-making. This has helped drive a lot of the features that we’ve already added, and can help shape where we go next.”
Thinking about the tool’s next steps, one goal is to consider specific assessments, case studies, and interface refinements that can be integrated into the tool and user experience to provide targeted decision support for a more diverse set of stakeholders.
Valuable support and contributions through UROP
The tool’s progress and evolution thus far underscore the collaboration and teamwork that is at the heart of the MCSC. Central to many of the tool’s technical updates is MIT undergraduate student Micah Borrero, who has been working with MacDonell through MIT’s Undergraduate Research Opportunities Program (UROP). Borrero, studying Aeronautics and Astronautics, has made valuable contributions to the backend code to help implement different parts of the tool’s functionality – applying his background and expertise to a new side of sustainability.
“One important concept I’ve been able to apply from my academic background to my research at the MCSC is a systems perspective – a higher level approach that is relevant in the MCSC when learning about topics like trucking and transportation modes,” Borrero said. “I love to work with large amounts of data and attempt to understand how various things interact.”

Another takeaway from working on this project has been the importance of considering the audience who will be using the tool.
“We wanted the tool to be accessible to any person regardless of their background, but even with this standard, it is important to look at more specific individual use-cases,” added Borrero. “As an aerospace engineering major, I haven’t always been exposed to considering the end user in my studies. The opportunity to work with the MCSC helped me develop the skills to better understand ways to represent complex datasets and challenges in a way that is easily accessible.”
With this interest in systems thinking, data-focused research, and drawing connections, working on the Geospatial Decision Support Tool was a natural fit for Borrero, and he hopes to continue similar explorations when he starts graduate school in the fall of 2024.
Ties-ins across pathways
MacDonell also worked with Sydney Sroka, MCSC Research Scientist, and Abigail Idiculla, an undergraduate studying civil and environmental engineering at Pennsylvania State University, who connected with the MCSC through the MIT Summer Research Program (MSRP). With MacDonell, they explored possible tie-ins to the interactive resilience mapping tool that they developed, which visualizes datasets of interest for resilience planning in the context of the energy transition.
“Even though the mapping tool Syndey developed is designed to support stakeholders in assessing climate risks rather than fleet decarbonization opportunities, we’ve found that there are some common classes of data like grid emission intensities that can support both assessments,” said MacDonell. “It’s been really valuable to engage with Sydney as we’ve developed the mapping tools to find these data-sharing opportunities”
As MacDonell refines the Geospatial Decision Support Tool’s functionality to support different audiences, there will also be many ways to leverage and learn from the sophisticated framework that Sroka developed in collaboration with social scientists at the MCSC to co-develop the map with diverse stakeholders.